Now Reading
Measuring Green Growth: Global Sustainable Competitiveness Index 2021
Scandinavia tops the 2021 Index, US #30, China #33
Measuring Green Growth: Global Sustainable Competitiveness Index 2021
Scandinavia tops the 2021 Index, US #30, China #33
Published 11-19-21
Submitted by SolAbility
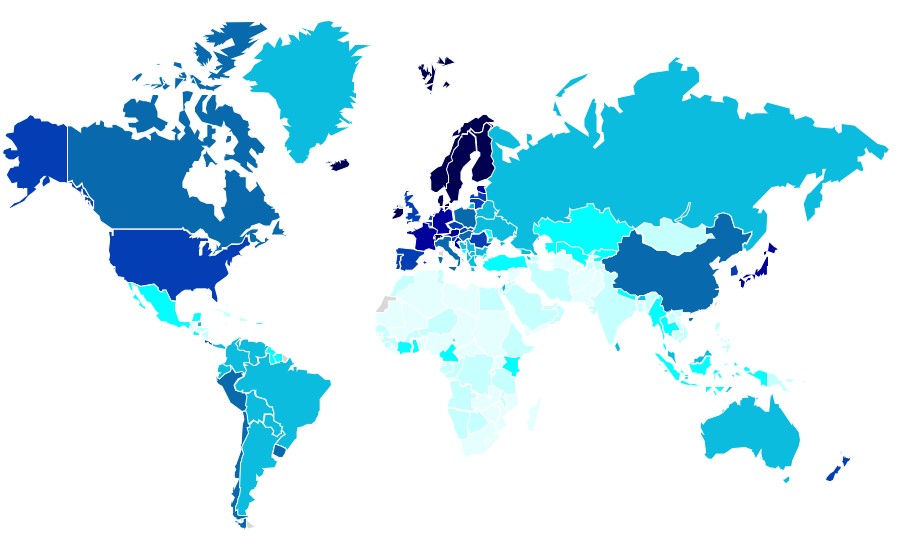
Sustainable Competitiveness World Map 2021
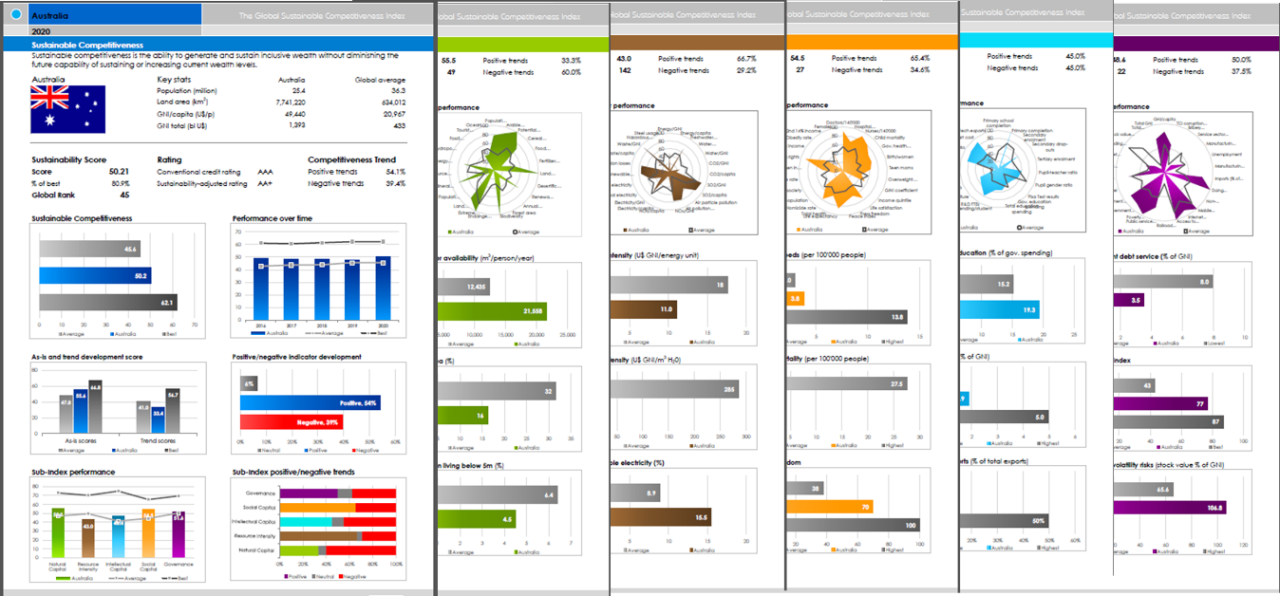
The Global Sustainable Competitiveness Index (GSCI), published since 2012, is the most comprehensive measurement of national development and green growth. The GSCI is calculated based on present and past performance in 131 quantitative indicators derived from recognized international organisations (UN, World Bank, IMF), grouped into 5 pillars: Natural Capital, Resource Intensity, Social Capital, Intellectual Capital, and Governance Efficiency.
Key insights from the 2021 Index include:
- Scandinavia continues to top the ranking: Sweden is leading the Sustainable Competitiveness Index, followed by all other Scandinavian nations.
- Only two countries in the Top 20 are not European: – Japan on 13, and New Zealand (14). South Korea follows on 21.
- The USA is ranked 30, ranking particularly low in resource efficiency and social capital – potentially further undermining the global status of the US in the future
- China is ranked 33 – very strong in Intellectual Capital, but low on Natural Capital and Resource Intensity
- Germany ranks 8, the UK 17. Brazil is 49, Russia 51, and India 130.
- Some of the least developed nations have a considerable higher GSCI ranking than their GDP would suggest (e.g. Nepal, Guyana, Laos, Belize, …)
- Asian nations (South Korea, Japan, Singapore, and China) lead the Intellectual Capital Index – the basis of innovation. However, achieving sustained prosperity is potentially compromised by Natural Capital constraints and increasing resource consumption.
- The Social Capital Index ranking is headed by Northern European (Scandinavian) countries, the result of economic growth combined with a widely accepted social consensus.
- The leading nation’s (Sweden) sustainable competitiveness score is 62 of a possible 100; the global average is 45: the World is far from being sustainable competitive
The Sustainable Competitiveness Model
The GSCI is based on the sustainable competitiveness model. The GSCI is calculated based on present and past performance in 131 quantitative indicators derived from recognized international organisations (UN, World Bank, IMF):
- Natural Capital Index
The given natural environment - Resource Efficiency Index
Resource usage per capita and per economic output - Social Capital Index
Social cohesion, health, freedom, security, equality - Intellectual Capital & Innovation Index
education and innovation indicators - Governance Performance Index
Infrastructure, resource allocation, corruption, business and fiscal considerations
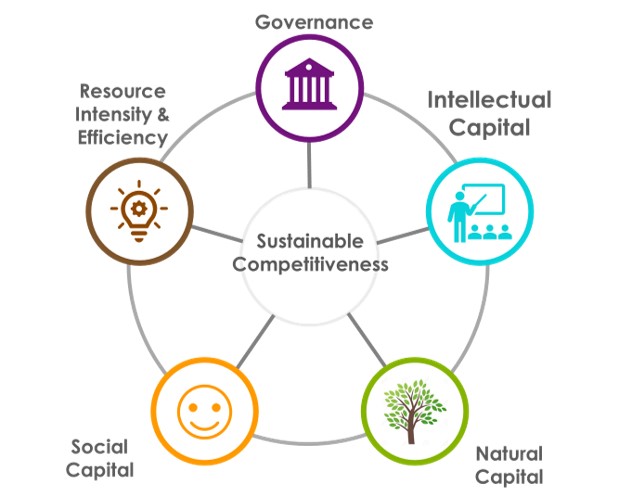
Sustainable Competitiveness: the model
State of the World
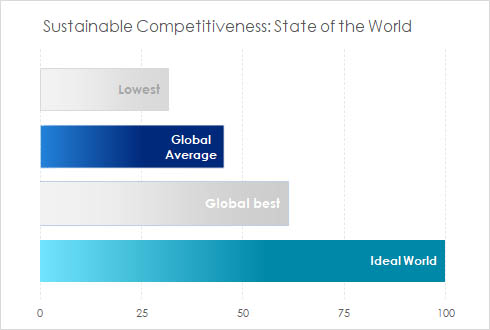
State of the World 2021
- Laos leads the Natural Capital Index, followed by Colombia, Paraguay, and Bolivia
- Malawi has the lowest resource intensity, followed by Kenya and El Salvador
- Iceland leads the Social Capital Index, followed by Norway and Sweden
- South Korea tops the Intellectual Capital Index, followed by China and Singapore
- Estonia tops the Governance Efficiency Index, followed by Ireland
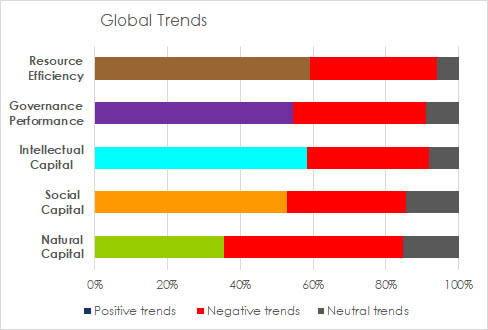
Global sustainability developments
The highest sustainable competitiveness score achieved in 2021 is 62, the global average Sustainable Competitiveness is 45: we are still far from a truly sustainable & competitive World.
A small majority of 53% of developments world-wide show positive trends, indicating that we can expect small, positive improvements in the future. However, a majority of developments in Natural Capital are deteriorating: unfortunately, we have to expect a further decline in the natural environment.
Individual performance reports for more than 180 countries
The full report, as well as scoes and individual reports for more than 180 countries are available from the Sustainable Competitiveness Index download site
SolAbility
SolAbility
SolAbility is a sustainable management consultancy and sustainability think-tank. SolAbility is the maker of 3 DJSI Suspersector Leaders, and proud publisher of the Global Sustainable Competitiveness Index.
SolAbility clients have achieve sustainable competitive advantage through implementation of sustainability management and communication.
SolAbility has presence in Korea and Switzerland.
More from SolAbility